Winter Recap
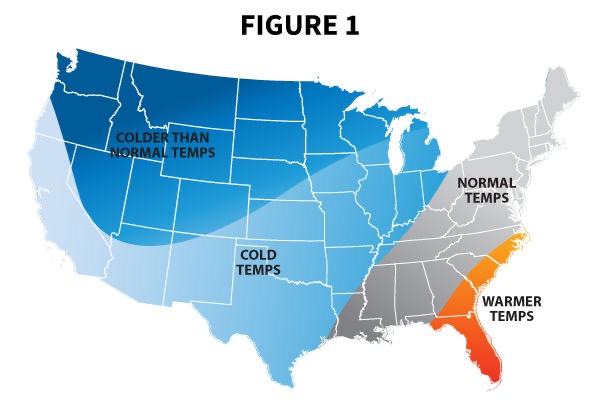
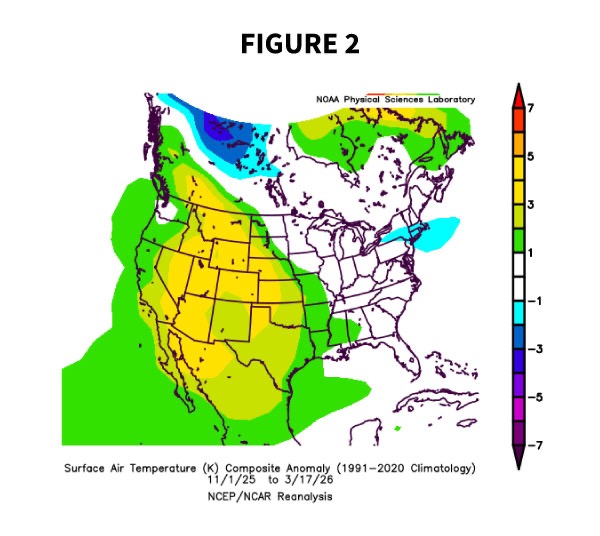
For Winter (Nov-Mar) 2025-26, ennrgy.com predicted the anomaly pattern as seen in Figure 1, with cold anomalies stretching from the Intermountain West through the northern Plains, cool conditions from Texas through the Ohio Valley, and normal conditions from the Gulf South through New England. Observed anomalies can be seen in Figure 2. Unfortunately, Winter 2025/26 was a miss for us. We were completely opposite how the anomalies actualized. We did, however, nail the risk to our forecast, with the cold shifting towards the East.
Summer 2026 Drivers
El Nino/Southern Oscillation (ENSO)
Long-time readers will know that we believe the El Nino/Southern Oscillation to be the overarching pattern underlying North American weather and climate, regardless of season. Other climate indices, mainly short-term, float on top. Note that ENSO includes both the El Nino and La Nina phenomena, although the name of the pattern does not specifically mention the latter.
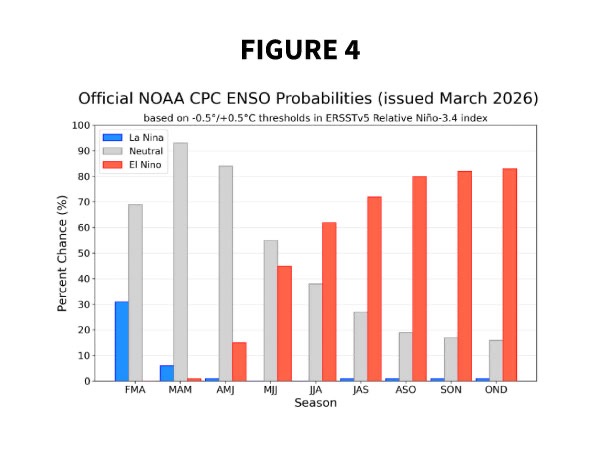
We are currently transitioning away from a La Nina pattern and are headed towards an ENSO-neutral state in the coming weeks. According to NOAA’s Climate Prediction Center (CPC), the ENSO-neutral state should last into June/July. From there, a strong El Nino should begin to develop through winter 2026/27.
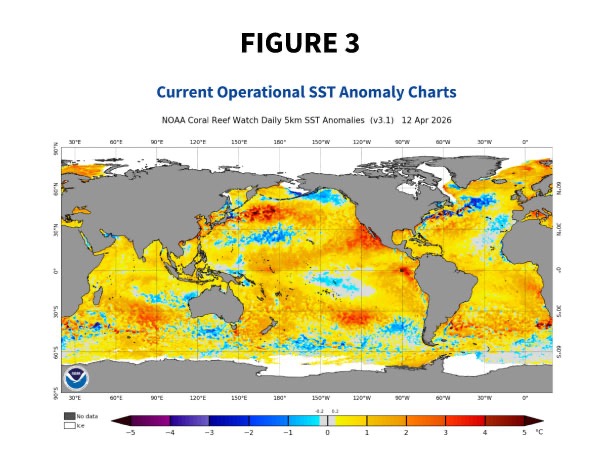
ENSO’s impact on summer is typically less than its impact on winter, as it is more a winter process. However, the extent to which it develops in July through September can have implications on US summer temperature. In the latest sea surface temperature (SST) anomaly map, Figure 3, produced by NOAA, the warming of the south Pacific Ocean has already begun. Combine this with a 62% chance of El Nino conditions developing in the June through August time frame (NOAA CPC, Figure 4), we think it reasonable to assume El Nino conditions, even if weak, for the latter half of summer. Doing so will lessen the outlook for high heat conditions in ERCOT but will likely increase the probability of high heat conditions for the Midwest through the Mid-Atlantic, with the potential for normal conditions in New England.
Soil Moisture
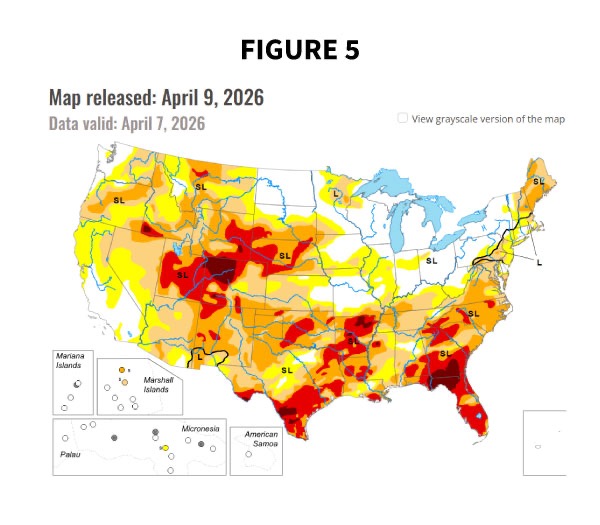
Current soil moisture conditions are shown in Figure 5. As you can see, much of the deregulated areas (and the United States, in general) are under some sort of drought condition as of mid April 2026. These dry conditions will exacerbate any summer heat (caused by high pressure ridging). This is so because there is less moisture in which to utilize the heat of the Sun in the evaporative process. Therefore, more radiation goes into heating the air, thus increasing the temperature to levels beyond that if adequate soil moisture was present.
The ennrgy.com Summer 2026 Outlook
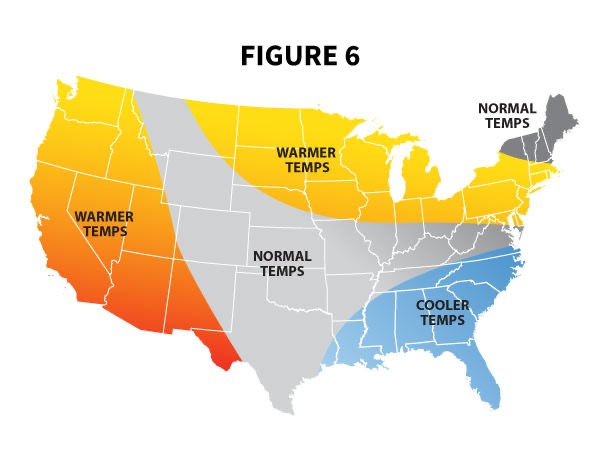
Given the strong potential for an early El Nino developing, along with a sufficient lack of soil moisture, we believe the focus of the summer warm anomalies will be mainly west of the Rockies and from the northern Plains through the northern Midwest, into the Great Lakes, and through to the Mid-Atlantic coast (Figure 6). We forecast the South-Central and Southeast U.S. to be cooler than normal, mainly due to increased precipitation. In looking at ERCOT, we expect west Texas to experience warm anomalies, while north and central Texas are forecast for normal conditions. Only the Texas Gulf coastal region should experience “cool-ish” conditions.
We believe the main risk to our seasonal temperature anomaly forecast is if the southwestern heat ridge expands eastward for much of the summer, encompassing ERCOT and perhaps the Plains and further into the Midwest/Ohio Valley, leading to major heat anomalies for much of the country.
Tropical Outlook
Theoretically and evidentiary, an El Nino summer produces far fewer named storms than either a Neutral or a La Nina summer. This is because of the increased wind shear over the Gulf of Mexico and southern Atlantic Ocean. Wind shear limits the formation and strengthening of tropical systems. We believe that Summer 2026 will be no different in that respect. Long-term normal numbers of named storms, hurricanes, and major hurricanes are 14, 7, and 3, respectively.
For 2026, our analog years show a definitive decrease from normal…10 named storms, 5 hurricanes, 2 major hurricanes. Regarding landfall, top locations are Texas, the Central Gulf Coast, and the East Coast, each with about 25-30% likelihood. Florida’s likelihood is half that of the others.

Ian Palao
VP, Client Operations
Makes complex energy data and situations feel intuitive for energy professionals. 30+ years of energy experience. ennrgy.com’s resident climatologist. | For more information, contact: ipalao@ennrgy.com
Weather Drives Markets. Are You Ready?
Risk360 gives your team real-time visibility into how weather impacts positions, load forecasts, and margin across all 7 ISOs.
Talk to Our Team →