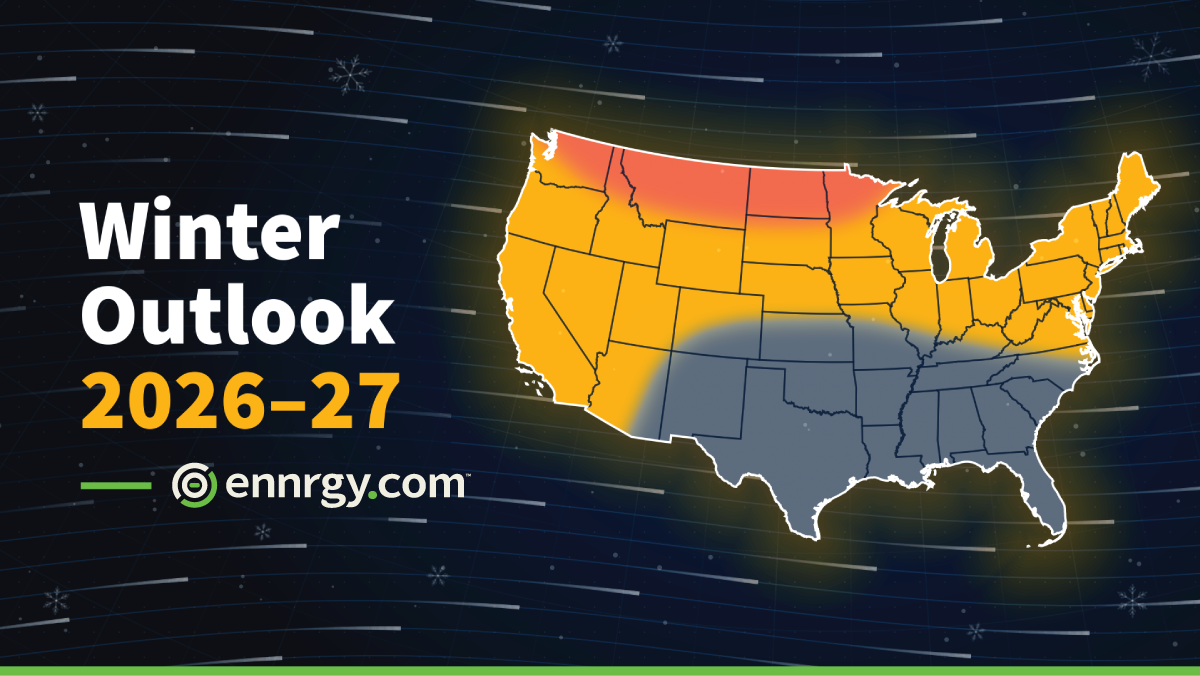
Winter 2026–27 Outlook
We expect winter 2026-27 to be warmer than normal across nearly all of the continental United States (Figure 1). The one exception is Texas through the Gulf South, where we expect temperatures near normal for the season.
We think the warmth will be widespread and will last through the season, with the largest departures across the northern tier. For energy markets, that means fewer heating degree days than normal in most major load centers, less weather-driven natural gas demand, and fewer severe cold-driven price spikes than in a typical winter.
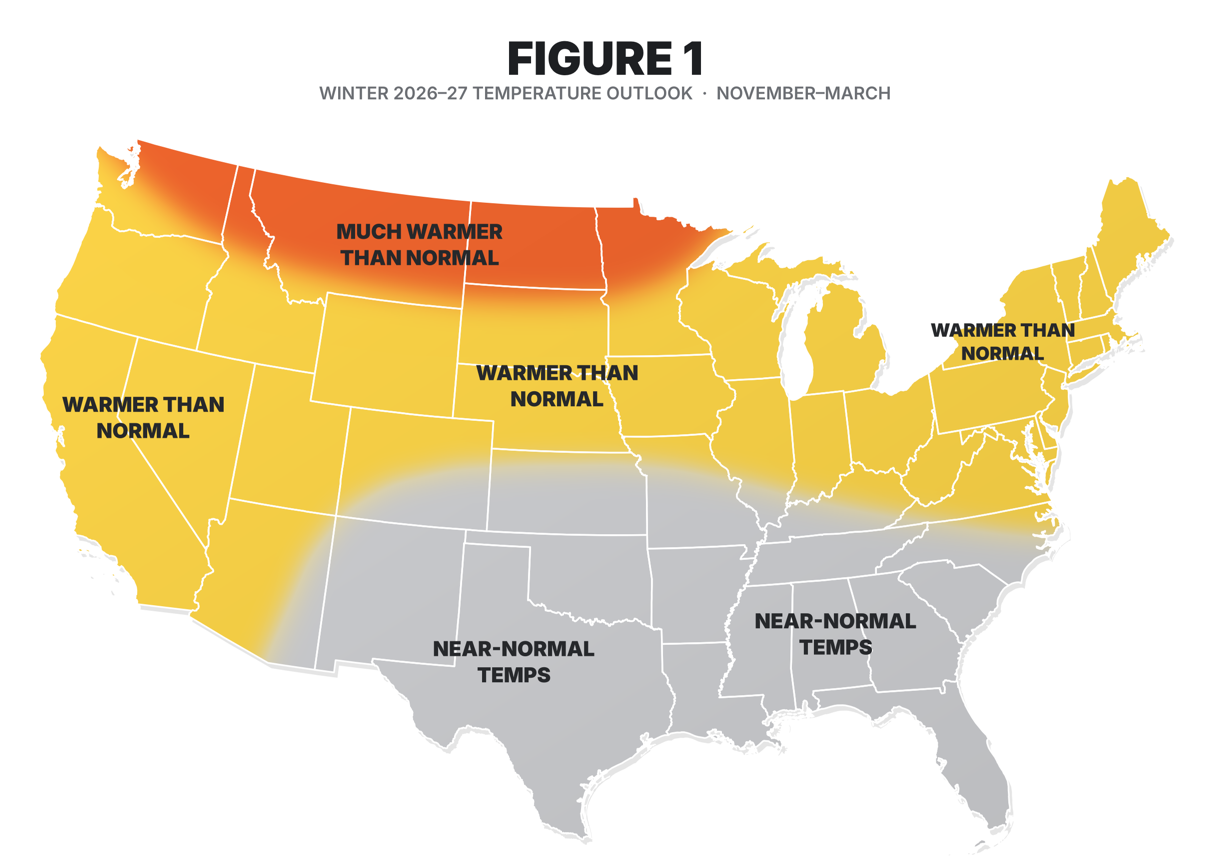
Figure 1. Winter 2026–27 temperature outlook, November–March.
The El Niño Driver
The main driver of this outlook is a strong and strengthening El Niño (Figure 2). NOAA’s Climate Prediction Center (CPC) has an El Niño Advisory in effect.
The Niño-3.4 index (an index describing sea surface temperature anomalies in the most pertinent Pacific Ocean region) was about +1.8°C in August, and CPC gives a greater than 90% chance of a very strong event this fall and winter (Figure 3).
It also gives a 75% chance of an exceptionally strong event (+2.5°C or more) during October–December. A mature El Niño of this size typically strengthens and extends the Pacific jet stream and deepens the Aleutian Low.
Both of these flood the northern half of the country with mild Pacific air and decrease the frequency and intensity of Arctic air intrusions into the Lower 48. The long-term warming trend adds to the warm signal expected for the upcoming winter.
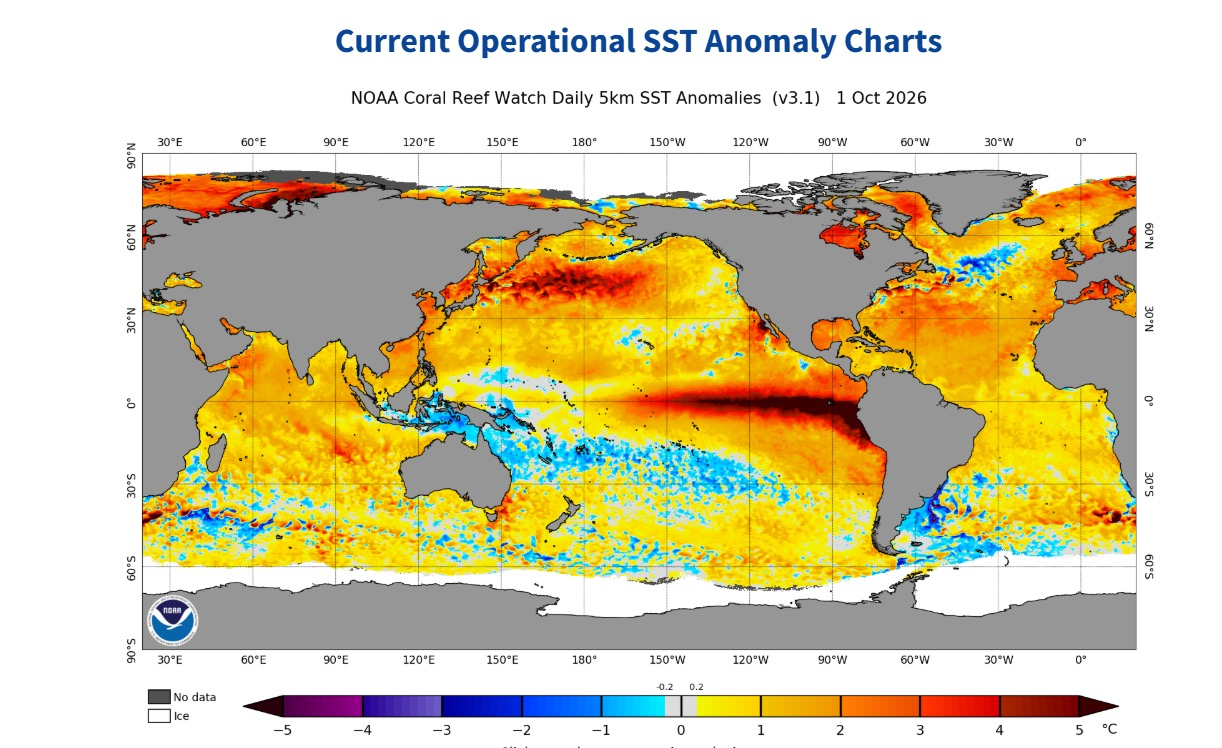
Figure 2. Daily sea surface temperature anomalies, 1 October 2026. Source: NOAA Coral Reef Watch.
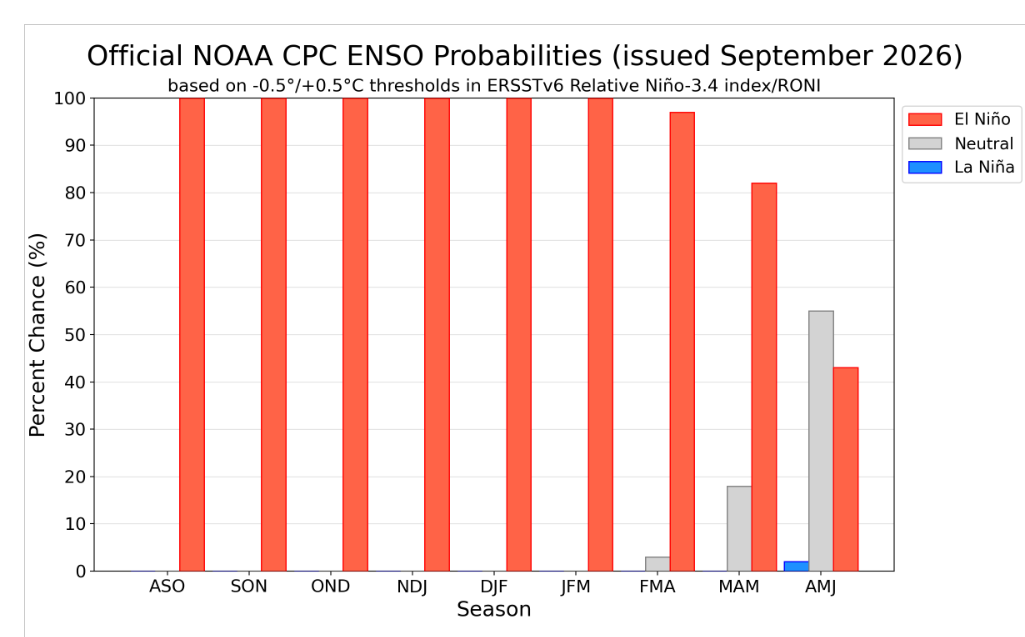
Figure 3. Official ENSO probabilities, issued September 2026. Source: NOAA Climate Prediction Center.
Regional Breakdown
By region, we expect the largest warm anomalies from the Pacific Northwest across the Northern Plains, Upper Midwest, and Great Lakes. The Northeast and Mid-Atlantic, including NYISO, ISO-NE, and PJM, should also run warmer than normal. We expect near-normal temperatures from Texas through the Gulf Coast states.
In strong El Niño winters, the southern jet stream carries frequent storms, cloud cover, and rain across the southern tier. That tends to hold down daytime highs and offsets the milder air mass, so we expect ERCOT and Southeast heating demand to land close to seasonal norms rather than below those norms.
Timing
We expect the warmest departures in the first half of the season, November through January, when the El Niño signal should be at or near its peak. By February and March, we expect more variability. El Niño will likely begin to weaken, and other patterns such as high-latitude blocking will have more influence. That doesn’t change the warm call for the season as a whole, but late winter carries the most risk of a meaningful cold stretch, especially east of the Rockies.
Risks to the Outlook
Risks to the outlook lean mostly toward colder conditions. As is usual in any September, Arctic sea ice reaches its minimum and begins to rebound, as is seen in Figure 4. Therefore, as we believe there will be ample ice to replenish the cold pool, the biggest risk our clients will face is a disruption of the stratospheric polar vortex that could lead to an intrusion of Arctic air. A sudden stratospheric warming can shift the pattern toward a negative Arctic Oscillation/North Atlantic Oscillation, bringing blocking and repeated Arctic outbreaks into the central and eastern U.S. for several weeks, even in a warm-leaning winter.
Finally, if the warmest waters sit farther west in the central Pacific instead of the eastern Pacific, the typical El Niño temperature pattern over North America could be weaker or look different. However, this latter scenario doesn’t appear likely at this point as the sea surface temperature anomaly pattern currently seen in the eastern tropical Pacific is one of a classic Niño (Figure 2).
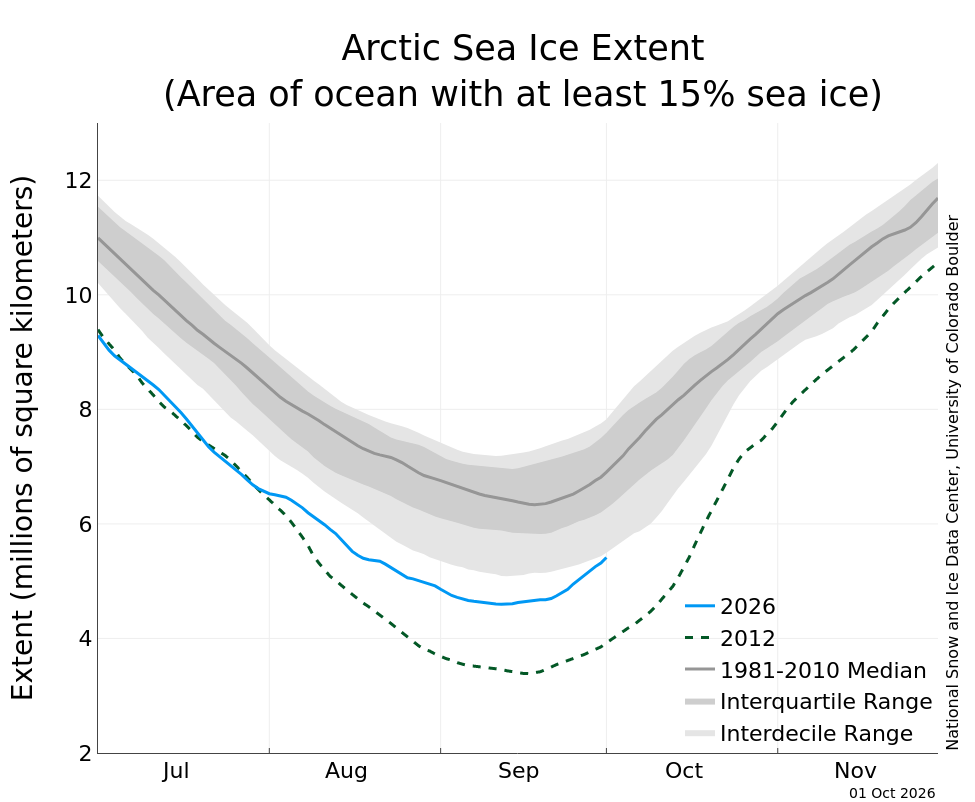
Figure 4. Arctic sea ice extent as of 1 October 2026. Source: National Snow and Ice Data Center, University of Colorado Boulder / NOAA Climate Prediction Center.
Texas and the Gulf South
For Texas and the Gulf South, the risks run in both directions. The persistent wet, cloudy pattern could push temperatures below normal instead of near normal. A strong El Niño does not rule out a brief but severe cold air outbreak into ERCOT, and even a few days of extreme cold can change the season’s load and price results. We recommend keeping winter hedges and reliability planning in place for the southern tier and watching the polar vortex and blocking signals closely from January into February and early March.
The MJO Wild Card
The Madden-Julian Oscillation (MJO) is another risk to the cold side, actually, the biggest risk. The MJO is a large area of tropical thunderstorms that moves east around the globe every 30 to 60 days and can change the U.S. weather pattern one to two weeks later. Climatologists describe the MJO as being in one of eight phases. When the MJO is active in phases 7, 8, and 1, it tends to build ridging over western North America and a trough over the East. That opens a path for Arctic air into the central and eastern U.S. and sometimes as far south as Texas. Those phases also raise the odds of high-latitude blocking and can help disrupt the polar vortex, which could stretch a short cold snap into several weeks.
Strong El Niño events usually suppress or disorganize the MJO, which supports our warm outlook. The main exposure is a strong, organized MJO pulse in late winter (Feb–Mar) as El Niño begins to fade. We’ll be tracking MJO forecasts through the season. They can flag cold stretches 10 to 20 days ahead, which helps with gas and power market positioning.

Ian Palao
VP, Client Operations
Makes complex energy data and situations feel intuitive for energy professionals. 30+ years of energy experience. ennrgy.com’s resident climatologist. | For more information, contact: ipalao@ennrgy.com
Weather Drives Markets. Are You Ready?
Risk360 gives your team real-time visibility into how weather impacts positions, load forecasts, and margin across all ISOs.